
Dashboard
Your workspace home: universal KPIs, an omnichannel activity chart, business outcomes, smart alerts, account health and your open tasks.
Objective
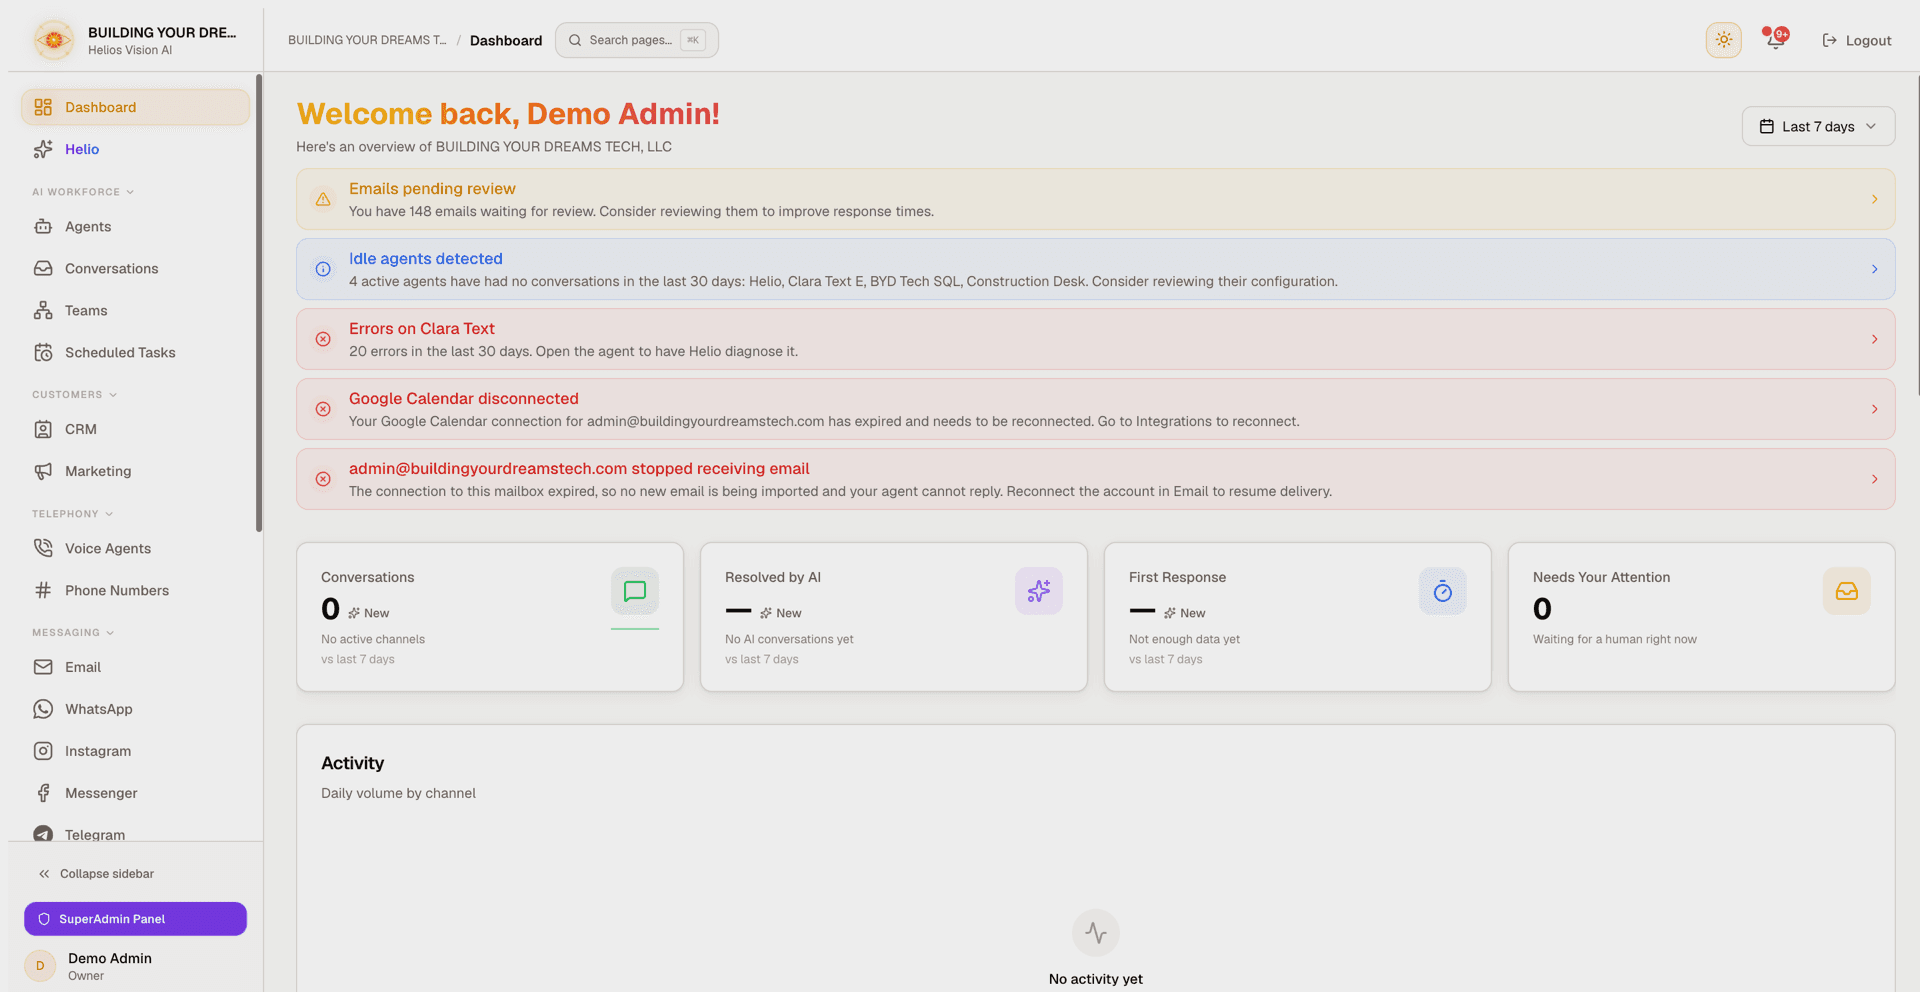
The Dashboard is the home screen of your workspace. It summarizes the health and activity of every channel you use — four universal KPIs with period-over-period trends, one omnichannel activity chart, business outcomes, channel distribution, agent performance, smart alerts, account health, your open tasks and a recent-activity feed. All figures respect your workspace timezone and the date range you select.
Access
Sidebar -> Dashboard
Route: /app/{tenant}/dashboard
Roles
- owner, admin, agent, viewer
Any active member of the workspace can view the Dashboard, regardless of role. Unlike Analytics, it is not restricted to admins. You only ever see data for the workspace you belong to.
Prerequisites
- No setup is required. The page loads immediately.
- Numbers populate as you connect channels, create agents, and start receiving conversations. An empty workspace shows placeholders and helpful "get started" links.
- Which panels appear depends on your active modules and plan (see Module and plan gating below).
Date range
The date-range selector (top right) controls the window for every KPI, chart, and trend. Trends compare the selected window against the immediately preceding window of the same length. The picker also shows the resolved from–to dates.
| Preset | Window |
|---|---|
| Last 7 days | Default on load |
| Last 14 days | Rolling 14 days |
| Last 30 days | Rolling 30 days |
| Last 90 days | Rolling 90 days |
| This month | From the 1st of the current month to today |
| Last month | The full previous calendar month |
The selection is not saved; the Dashboard reopens on Last 7 days. Changing the range refetches in place — the current view dims briefly instead of flashing back to skeletons, and the picker icon becomes a spinner while the new range loads.
KPI cards
Four KPI cards sit below the header. They are the same for every workspace on every plan — they describe the work the AI did, not any single module. Trends read as vs \{range\} (for example, vs last 7 days), or New when the previous period had no activity.
| Card | Value | Notes |
|---|---|---|
| Conversations | Conversations across every channel in the window | Subtitle counts the channels with traffic; includes a small sparkline of the daily totals |
| Resolved by AI | Percentage of AI-handled conversations that were resolved without a human | Only conversations the AI actually handled count toward the rate; shows — with No AI conversations yet when there is nothing to measure |
| First Response | Median time to first response | Shown in seconds, minutes, or hours; a shorter median reads as an improvement (green). Shows — with Not enough data yet on small samples |
| Needs Your Attention | Conversations waiting for a human right now | Point-in-time queue, so it has no trend. The whole card is a link |
The Needs Your Attention card opens Conversations pre-filtered to the same queue it counts (/app/\{tenant\}/conversations?attention=1): conversations flagged for attention, escalated by the AI, or under human takeover. Card and list share one definition, so they always agree.
Activity chart
A single Activity chart ("Daily volume by channel") replaces the separate per-module charts. It stacks daily volume for every channel you use: WhatsApp, Web Chat, Email, Voice, Instagram, Messenger, Telegram, and TikTok.
- Web Chat is always shown.
- Every other channel appears when your plan or modules enable it and it had traffic in the selected range — a permanently flat zero line is never drawn.
- The Email series counts inbound mail only (what came in), the same question the other channels answer. Sent volume lives in the Email panel below.
Business outcomes
A Business band appears only when the workspace has CRM or campaign activity — a pure-support workspace is not shown empty cards.
| Card | Value | Subtitle |
|---|---|---|
| New Contacts | Contacts captured in the range, with a trend | Captured in this range |
| Deals Won | Deals moved to a won stage in the range | \{moves\} pipeline moves |
| Open Tasks | Open follow-up tasks across your CRM | Across your CRM |
| Campaign Replies | Reply rate when the range had sends, otherwise the reply count | \{sent\} sent · \{active\} running |
Email and Voice panels
Module-specific numbers live in their own panels, shown only to workspaces that have the module:
- Email (Inbox module enabled) —
Received,Sent, andAwaiting approvalfor the selected range. TheAwaiting approvaltile links to the Inbox. - Voice (plan includes Voice) —
Calls,Minutes, andAvg. lengthfor the selected range.
Channels and agents
A Channels & Agents band groups three panels, all scoped to the selected date range:
- Channel Distribution — a share breakdown of messages by channel in the selected range. Channels disabled by your plan or modules are excluded, and so are channels with zero traffic in the range.
- Top Agents — the five most active agents ranked by interactions in the selected range. An agent's bar turns red if it has recorded errors. A
View all agentslink appears when you have more than five active agents. - Agent Performance — up to five agents sorted by activity in the range, each with an active/inactive status dot and per-channel counters (email and voice counters appear only when those modules are enabled). When an agent has errors, a red badge with the count appears — click it to open that agent's failures page, which explains each error in plain language. A
Showing X of Yline and aView all agentslink appear when relevant.
Empty states link you to create your first agent or to view conversations.
Activity heatmap
When there is enough data, an Activity Heatmap shows your busiest hours across the week so you can see when demand peaks. It is hidden until activity exists.
My open tasks
This panel lists your own pending follow-up tasks (up to 10), drawn from Contacts, ordered by due date. Overdue tasks show their date in red. Each task links to its contact. Click the circle to mark a task complete; the row animates and drops off the list. The header shows a \{count\} pending badge. Only tasks assigned to you appear here.
Recent activity
A feed of the latest events (up to 15), newest first: conversations across all your connected channels and automation runs. Conversations flagged for attention, escalated, or under human takeover carry a warning status; automation runs read success, error, or info depending on how they ended.
Account health
An Account Health panel shows a compact set of numbers about your account rather than your traffic. Tiles appear only when they apply to you:
- Credits left — for workspaces on managed AI credits: your balance, when the plan's included credits renew, and a note that included credits reset each cycle and do not roll over while top-ups never expire. A workspace that uses its own AI provider key but still holds purchased top-up credits sees them as
Purchased credits (never expire). - Plan usage — the percentage of your monthly message allowance used, as
\{used\} of \{limit\} messages, counted per calendar month. - Active agents — agents currently active.
- Channels with traffic — channels that moved in the selected range.
- Scheduled runs — scheduled-task runs in the range, with the failed count called out.
- Credits used this cycle — managed-credit consumption since the billing cycle started, with the cycle's start date.
System status
Below Account Health, a System Status card reads All Systems Operational in green, or \{count\} agent errors detected in red when agents have unresolved errors. The card is a link: when red, it opens the failures page of the agent with the most errors, where every error is explained in plain language along with what to do about it.
Smart alerts
Actionable banners appear above the KPIs when the workspace needs attention. Each links to the exact place to fix the issue.
| Alert | Trigger | Links to |
|---|---|---|
| Emails pending review | More than 10 emails awaiting approval (Inbox module only) | Inbox |
| Scheduled tasks failing | One or more scheduled runs failed in the selected range | Scheduled Tasks |
| Idle agents detected | Active agents with no conversations in the last 30 days (agents created in the last 7 days are excluded) | Agents |
| Errors on {agent} | One banner per agent with more than 5 unresolved errors in the last 30 days (resolved errors and warnings do not count; disabled agents are excluded) | That agent's failures page, where Helio can diagnose the errors |
| {Provider} disconnected | A connected integration (Google Calendar, Microsoft Calendar, Gmail, Outlook) has lost its connection — including accounts the platform disabled after repeated refresh failures | Integrations |
| Email mailbox needs attention | One banner per broken mailbox, with the specific reason: the connection expired, syncing has stalled, the last import failed, the mailbox never imported email, or no agent is assigned to it | The email account settings in Inbox |
| Voice provider error | A voice provider failure such as an exhausted quota or an invalid key | Integrations |
Module and plan gating
The Dashboard tailors itself to what your workspace has turned on:
- Email / Inbox — the Email panel, the Email series in the Activity chart, the email alerts, and the per-agent email counters only appear when the Inbox module is enabled.
- WhatsApp, Voice, Instagram, Messenger, Telegram, TikTok — each channel's series and counters appear only when your plan includes the channel.
- Any enabled channel still needs traffic in the selected range to appear in the Activity chart and Channel Distribution (Web Chat is always drawn in the chart).
- The four KPI cards, Business band, tasks, recent activity, Account Health, and System Status are universal.
After checkout
If you land on the Dashboard right after upgrading, a confirmation toast appears and your plan is synced automatically. If you cancelled checkout, an informational toast is shown instead. Either way you stay on the Dashboard.
Good practices
- If most metrics read zero, check Integrations and Agents first — data appears only once channels are connected and agents are handling traffic.
- Use the date-range selector to compare periods; the trend arrows are relative to the previous window of the same length.
- Act on smart alerts promptly — each one deep-links to the exact place to fix the issue, and agent-error banners land directly on the explained failure list.
- Keep an eye on the Needs Your Attention card: it is the live queue of conversations waiting for a human, one click away from the filtered list.
- Clear your open tasks from the Dashboard to keep follow-ups on track.
Common errors
- Failed to load dashboard — a transient load error shows a Retry button; use it to refetch.
- A
Newtrend means the previous period had no activity, so no percentage can be computed. - A
—value on Resolved by AI or First Response means there is not enough data to measure yet, not a zero. - The selected date range resets to Last 7 days each time you open the page.
- Figures are bucketed in your workspace timezone, so evening activity lands on the correct local day.
- The Needs Your Attention count can look "stuck" across date ranges: it is a point-in-time queue on purpose and does not follow the selected range.
Related
- Conversations — the inbox the attention queue and activity feed link into.
- Agents — where idle-agent and error alerts lead.
- Inbox (Email) — pending review, mailbox health, and the Email panel.
- Integrations — reconnect calendars, mailboxes, and voice providers.
- Scheduled Tasks — the runs behind the scheduled-task tiles and alerts.
- Contacts — the source of your open tasks and new-contact numbers.
- Analytics — deeper reporting beyond the Dashboard summary.
- Billing & Usage — credits, message limits, and plan changes.
Authentication & Access
Sign in, sign up, Google sign-in, email verification, password recovery and team invitations in Helios Vision AI.
Helio (AI assistant)
Chat with Helio, your AI co-worker: look up anything in your workspace, run checks, and apply reviewed changes to agents, channels, CRM, and more.